File:Y-factor sketch.jpg
From KYNNpedia
Y-factor_sketch.jpg (320 × 240 pixels, file size: 29 KB, MIME type: image/jpeg)
This file is from Wikimedia Commons and may be used by other projects. The description on its file description page there is shown below.
 | This image was uploaded in the JPEG format even though it consists of non-photographic data. This information could be stored more efficiently or accurately in the PNG or SVG format. If possible, please upload a PNG or SVG version of this image without compression artifacts, derived from a non-JPEG source (or with existing artifacts removed). After doing so, please tag the JPEG version with {{Superseded|NewImage.ext}} and remove this tag. This tag should not be applied to photographs or scans. If this image is a diagram or other image suitable for vectorisation, please tag this image with {{Convert to SVG}} instead of {{BadJPEG}}. If not suitable for vectorisation, use {{Convert to PNG}}. For more information, see {{BadJPEG}}. |
Summary
| DescriptionY-factor sketch.jpg |
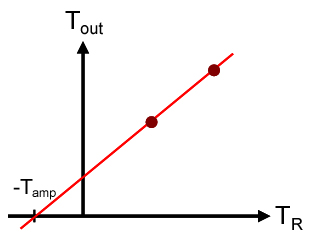
English: Sketch of a typical plot used in the Y-factor method for determining the gain and noise temperature of an amplifier. By D.F. Santavicca. |
| Date | 2 September 2011 (original upload date) |
| Source | Transferred from en.wikipedia to Commons. |
| Author | Tls60 at English Wikipedia |
Licensing
Tls60 at English Wikipedia, the copyright holder of this work, hereby publishes it under the following license:
This file is licensed under the Creative Commons Attribution 3.0 Unported license.
Attribution:
- You are free:
- to share – to copy, distribute and transmit the work
- to remix – to adapt the work
- Under the following conditions:
- attribution – You must give appropriate credit, provide a link to the license, and indicate if changes were made. You may do so in any reasonable manner, but not in any way that suggests the licensor endorses you or your use.
Original upload log
The original description page was here. All following user names refer to en.wikipedia.
| Date/Time | Dimensions | User | Comment |
|---|---|---|---|
| 2011-09-02 19:13 | 320×240× (29483 bytes) | Tls60 | Sketch of a typical plot used in the Y-factor method for determining the gain and noise temperature of an amplifier. By D.F. Santavicca. |
Captions
Add a one-line explanation of what this file represents
Items portrayed in this file
depicts
2 September 2011
29,483 byte
240 pixel
320 pixel
image/jpeg
226c7e4faef92da82807b439c967ec45e2347851
File history
Click on a date/time to view the file as it appeared at that time.
| Date/Time | Thumbnail | Dimensions | User | Comment | |
|---|---|---|---|---|---|
| current | 20:13, 17 November 2014 |  | 320 × 240 (29 KB) | wikimediacommons>Arthunter | Transferred from en.wikipedia |
File usage
The following page uses this file:
Metadata
This file contains additional information, probably added from the digital camera or scanner used to create or digitize it.
If the file has been modified from its original state, some details may not fully reflect the modified file.
| Orientation | Normal |
|---|---|
| Horizontal resolution | 150 dpi |
| Vertical resolution | 150 dpi |
| Software used | Adobe Photoshop CS Windows |
| File change date and time | 15:10, 2 September 2011 |
| Color space | sRGB |
| Image width | 320 px |
| Image height | 240 px |
| Date and time of digitizing | 10:10, 2 September 2011 |
| Date metadata was last modified | 10:10, 2 September 2011 |

